Debugging
Just as you are able to build and develop Donet using only free and open source software, you can also troubleshoot Donet with only free and open source software. This section documents the various debugging methods and utilities you can use to troubleshoot Donet, as a developer and a user.
Daemon Logs
The Donet daemon periodically outputs log messages for debugging purposes. A typical log message might look like this:
[2024-10-21 23:12:12] INFO: donetd::network::tcp: Opened new TCP listening socket at 127.0.0.1:7199.
The log message format is very familiar to Astron’s logging format.
The first part of the message, [2024-10-21 23:12:12], is the
timestamp of when the message was logged. The second part, INFO,
is the severity level of the log event. The third part,
donetd::network::tcp, is the name of the module that generated
the log message. The severity levels are, in decreasing order:
error, warn, info, debug, and trace.
You can configure Donet’s log level via its TOML configuration file:
[daemon]
log_level = "info" # default: "info"
Network Analysis
While developing for Donet, or developing an application that uses Donet, you will find it extremely useful to be able to profile the network activity between your application(s) and the Donet cluster. You can use the free and open source Wireshark program to intercept network messages from Donet.
In the Donet repository, under the directory tools/wireshark, you
can find a Lua script that serves as a Wireshark plugin for
dissecting network packets that use the Donet protocol. To install
the lua plugin on your local machine’s Wireshark installation, read
the Wireshark plugin installation guide.
In a nutshell, you simply need to copy the lua file over to a certain directory that Wireshark reads. This depends on what operating system your machine runs.
On Windows, copy the lua file to: %APPDATA%\Wireshark\plugins.
On Unix-like systems, such as GNU/Linux, copy the lua file to:
~/.local/lib/wireshark/plugins.
On MacOS, the directory is %APPDIR%/Contents/PlugIns/wireshark
if Wireshark is installed as an application bundle, otherwise the
plugin directory is located at INSTALLDIR/lib/wireshark/plugins.
Caution
On Unix-like systems, avoid installing Wireshark as a flatpak as this version of Wireshark does not support capturing data. See Wireshark flatpak repo issue 4 for more details.
If your network interfaces are not being enumerated by a system installation of Wireshark, you may need to run the following command after installation:
$ sudo usermod -a -G wireshark $USER
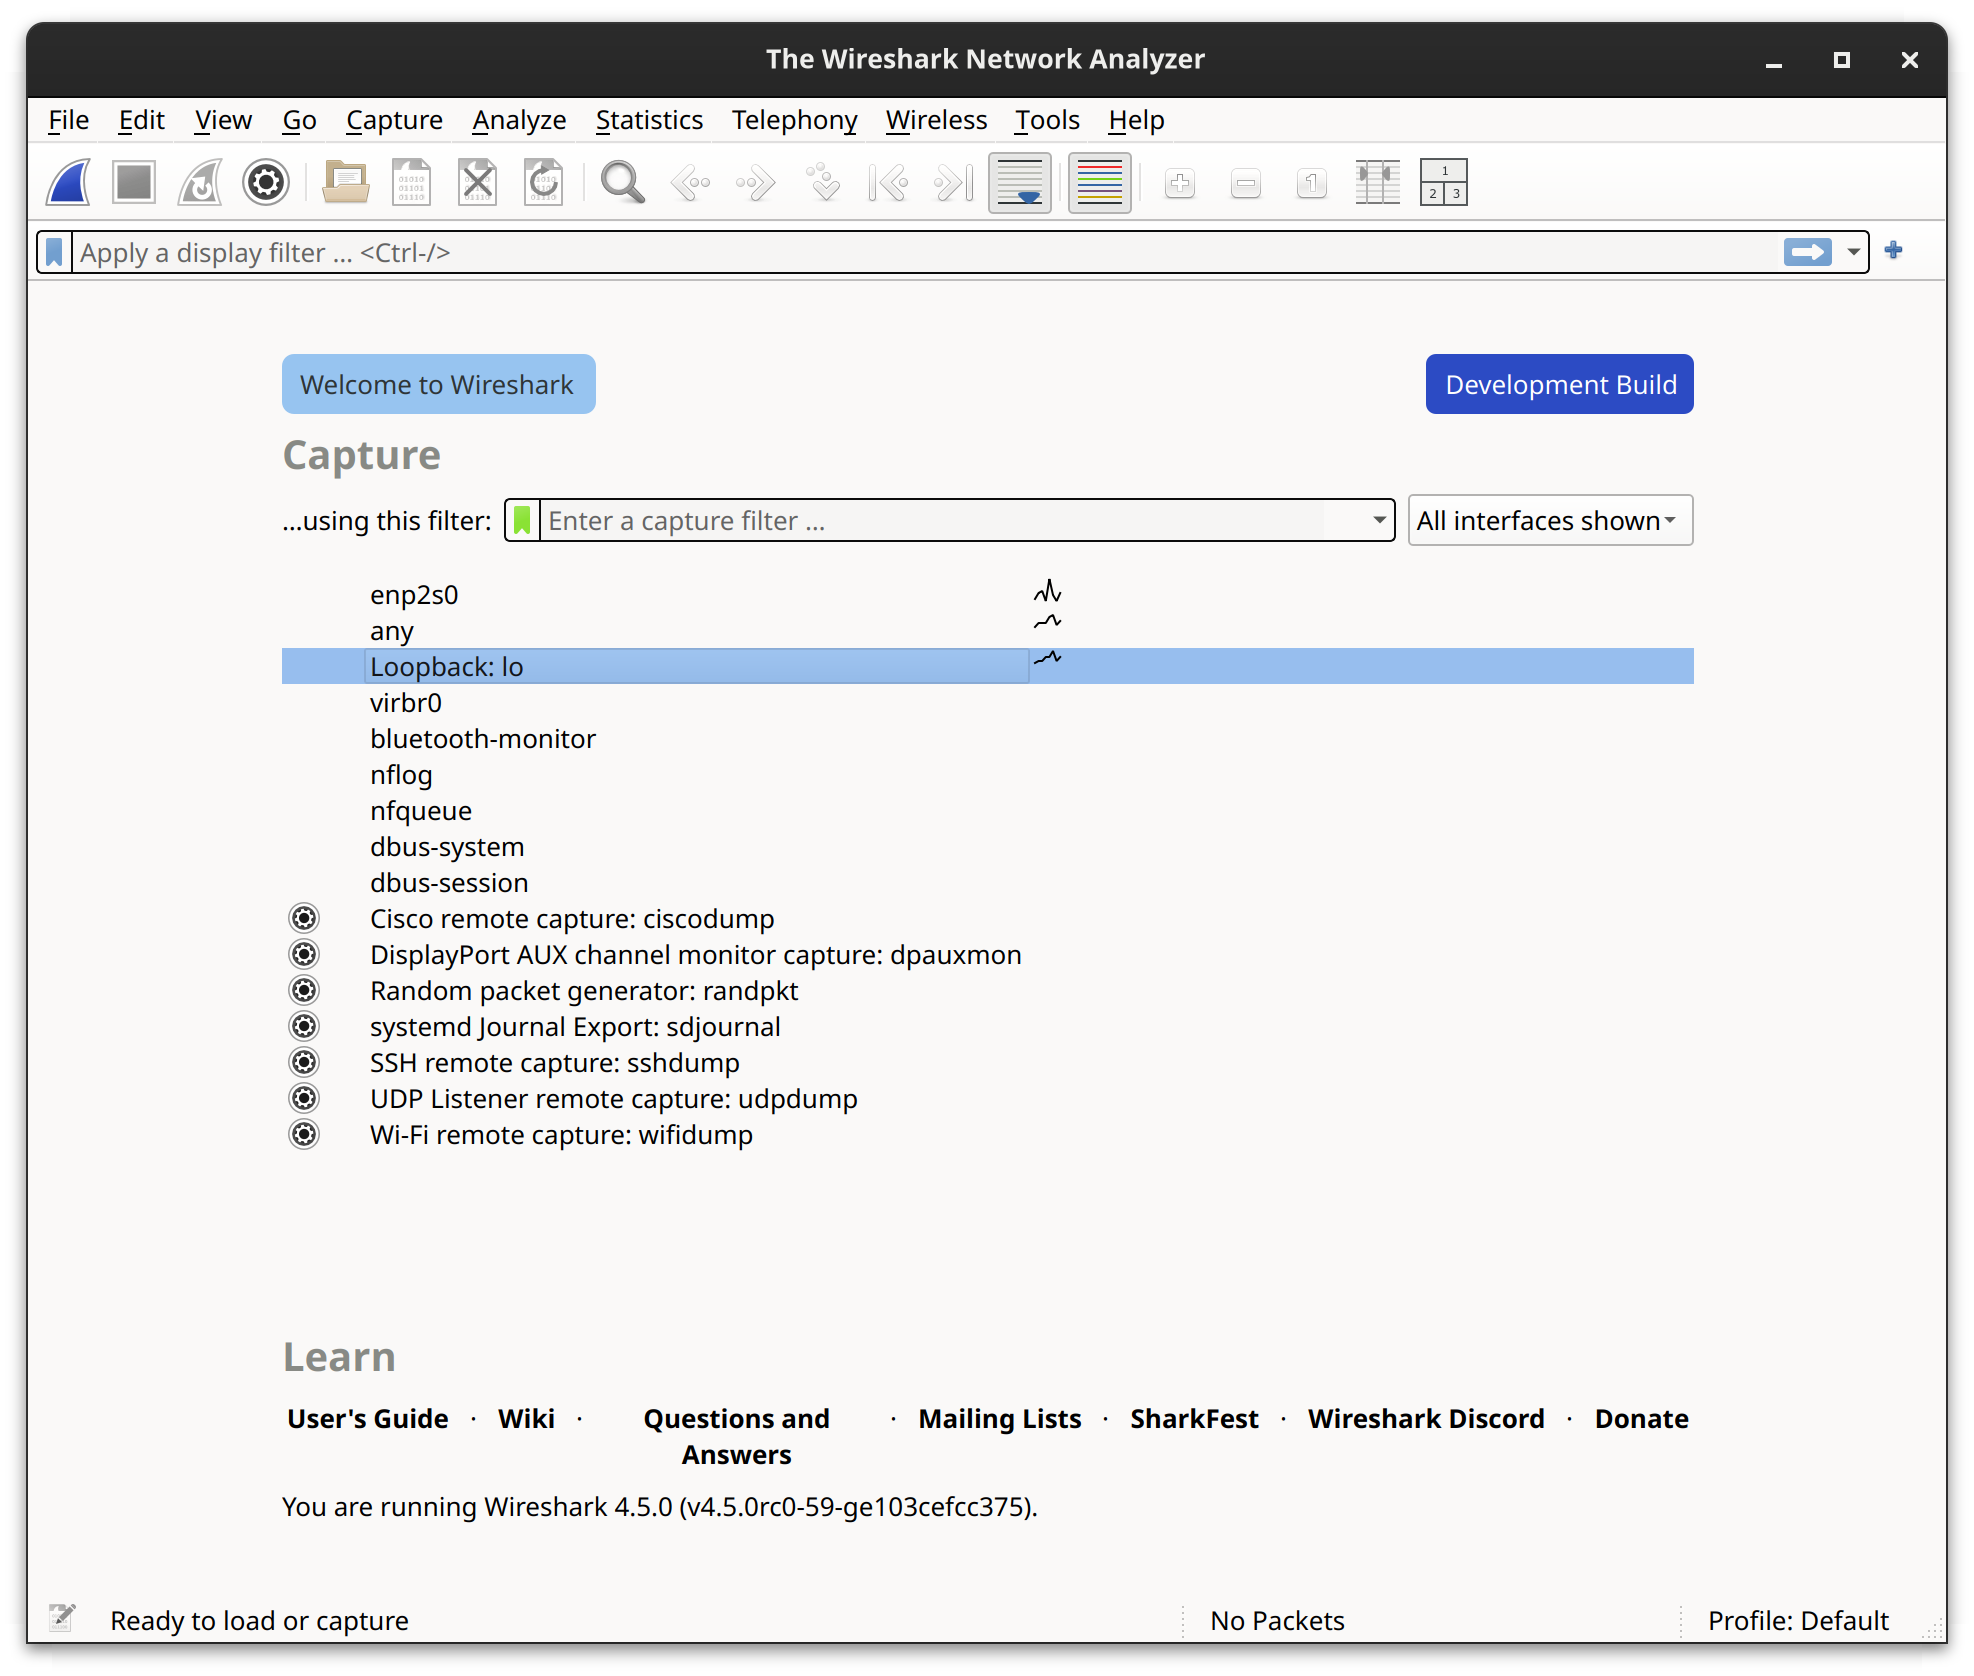
The following image is what the Wireshark graphical main menu should look like if set up correctly for capturing network packets. Your machine’s network interfaces, such as Ethernet, WI-FI, loopback, etc. should be listed in this menu. Interfaces may differ across machines, but loopback (lo) should be there on all systems. This is the network interface that local development applications using Donet will communicate through.
Note
The reserved IPv4 address range for loopback is 127.0.0.0/8. For IPv6, it is ::1/128, where the mask is 128 bits, meaning there is no range of addresses for loopback, but rather only one single address, which is ::1.

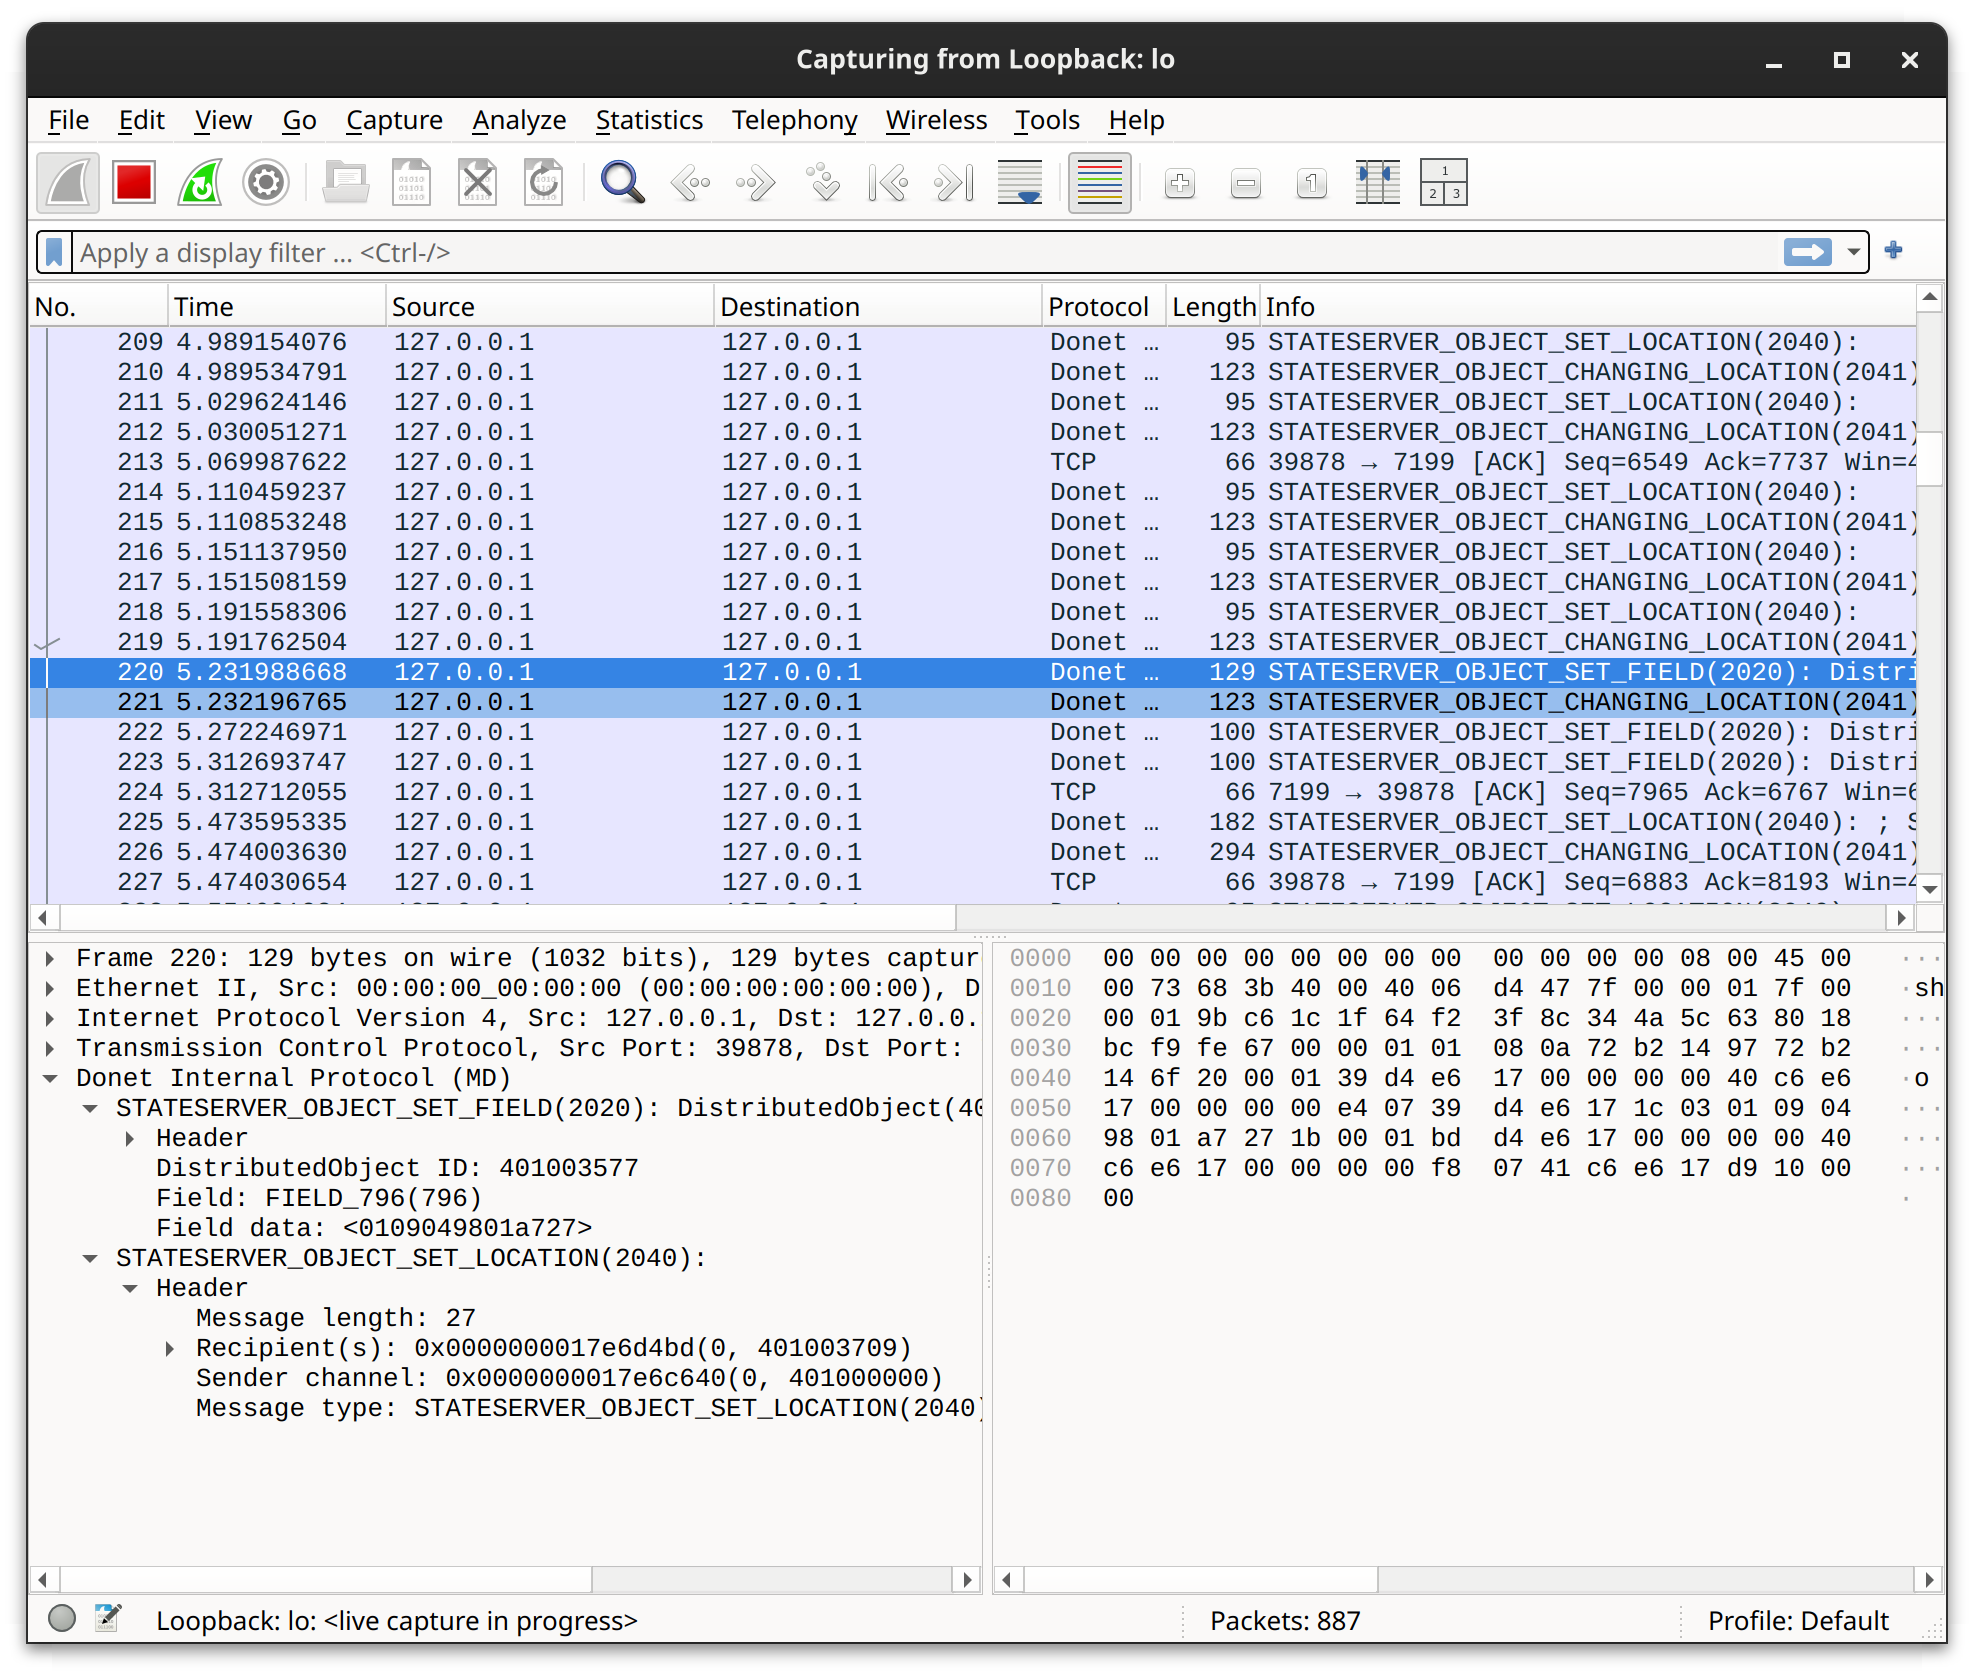
After selecting the loopback interface, Wireshark should start to intercept network packets being sent to that interface. The following image is an example of Wireshark intercepting network messages that are using the Donet protocol. If you select a packet to inspect, the Lua plugin should dissect the message for you and show details in the bottom-left panel, such as sender/recepients and message type fields.

Debugging with GDB
If you are making modifications to the Donet source, it is crucial to use a debugger program to properly troubleshoot and resolve bugs during development. It is recommended to use GDB as your debugger. If you are unfamiliar with the GNU project debugger (GDB), you can read “Debugging with GDB”.
